
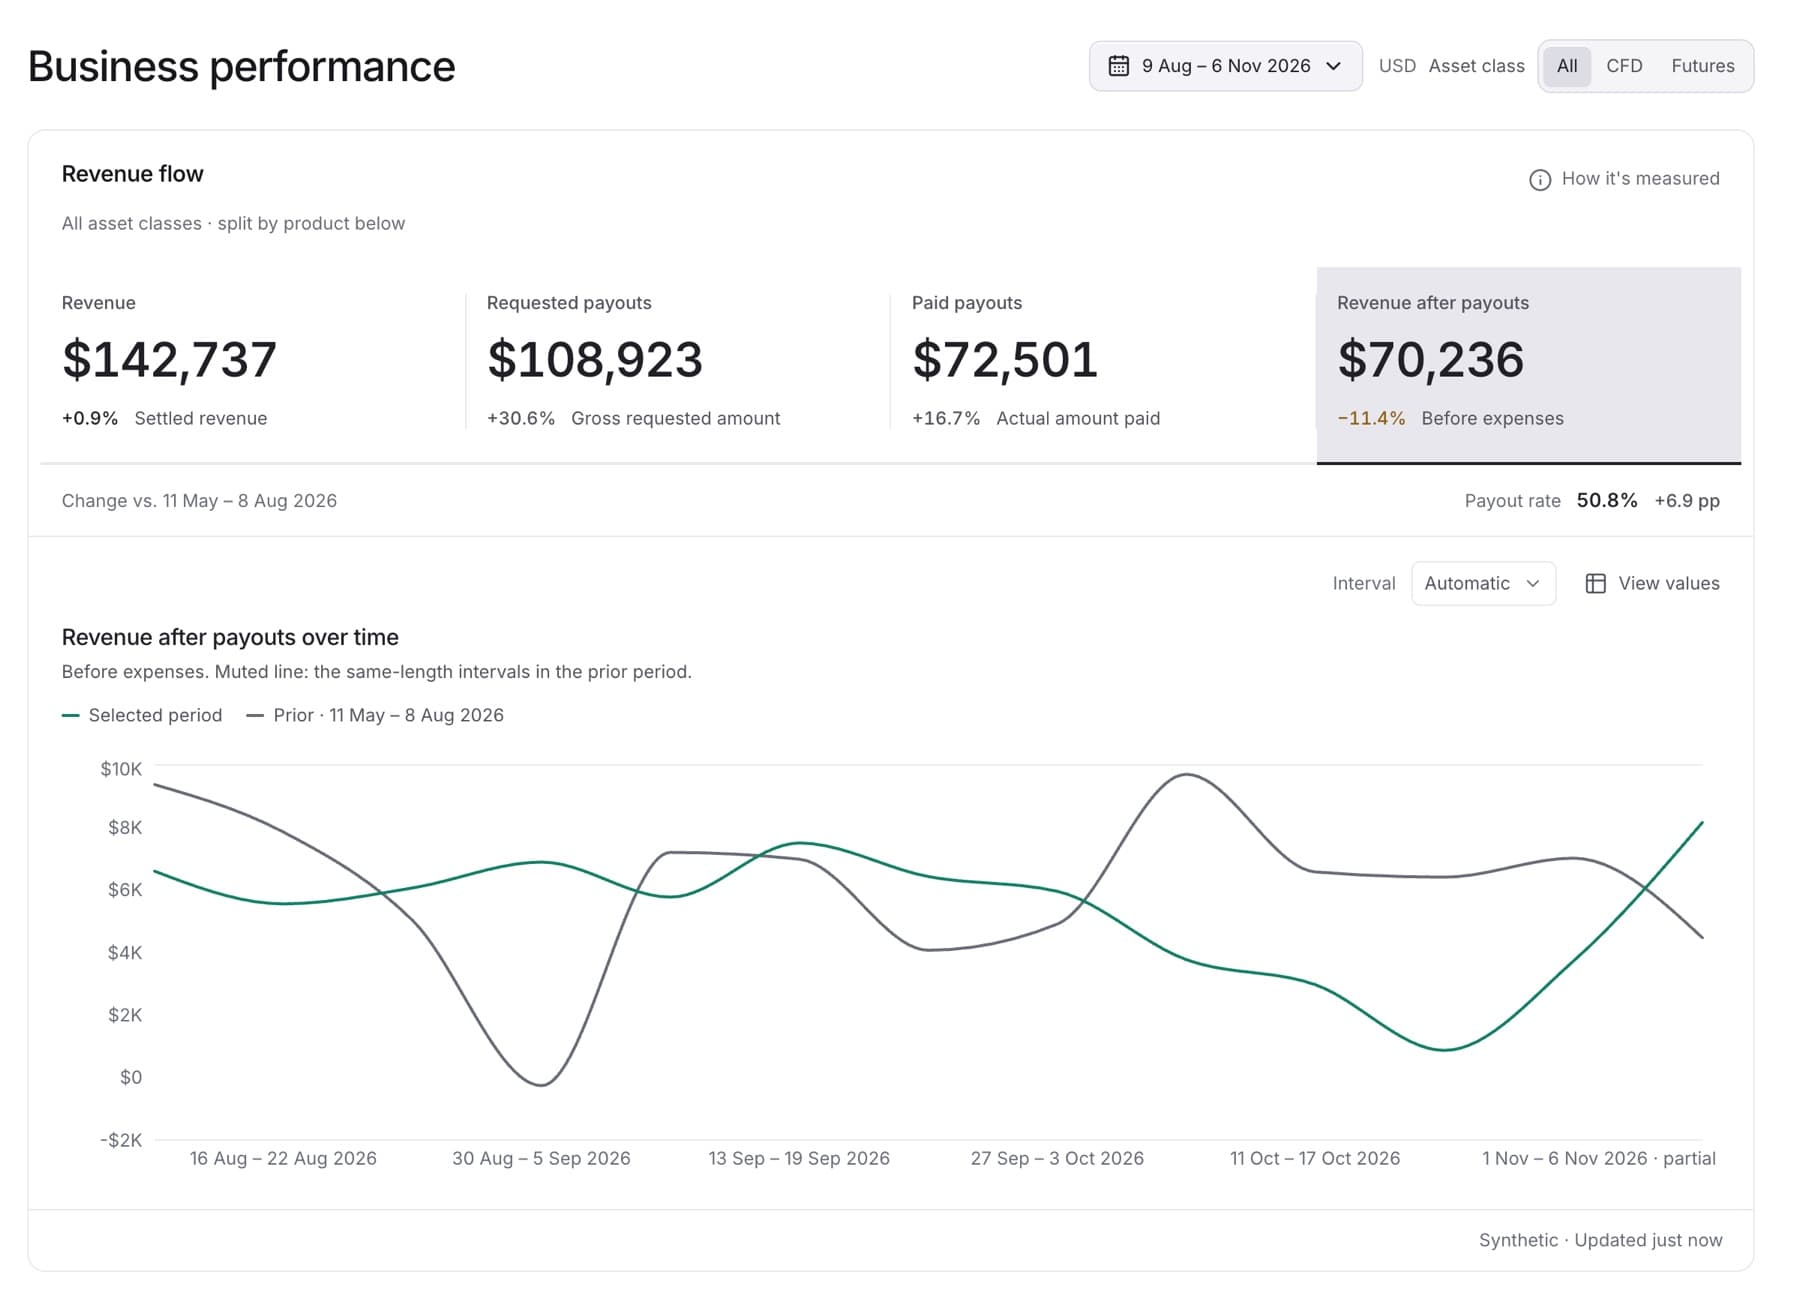
See how much revenue the firm kept after payouts in a period, and how that compares with the period before. Any workspace role can do this.
- Click Business Performance in the side menu.
- Click the period button at the top right (it shows the current date range).
- Choose a preset, for example Last 90 days or Previous quarter. For your own dates, pick a start day and an end day in the calendar, then click Apply.
- Read the four measures under Revenue flow. Each one shows its change against the prior period.
- Click a measure, for example Paid payouts, to show its trend in the chart.
- Optional: open Interval and choose Weekly or Monthly.
- Optional: click View values to see the chart's numbers as a table.
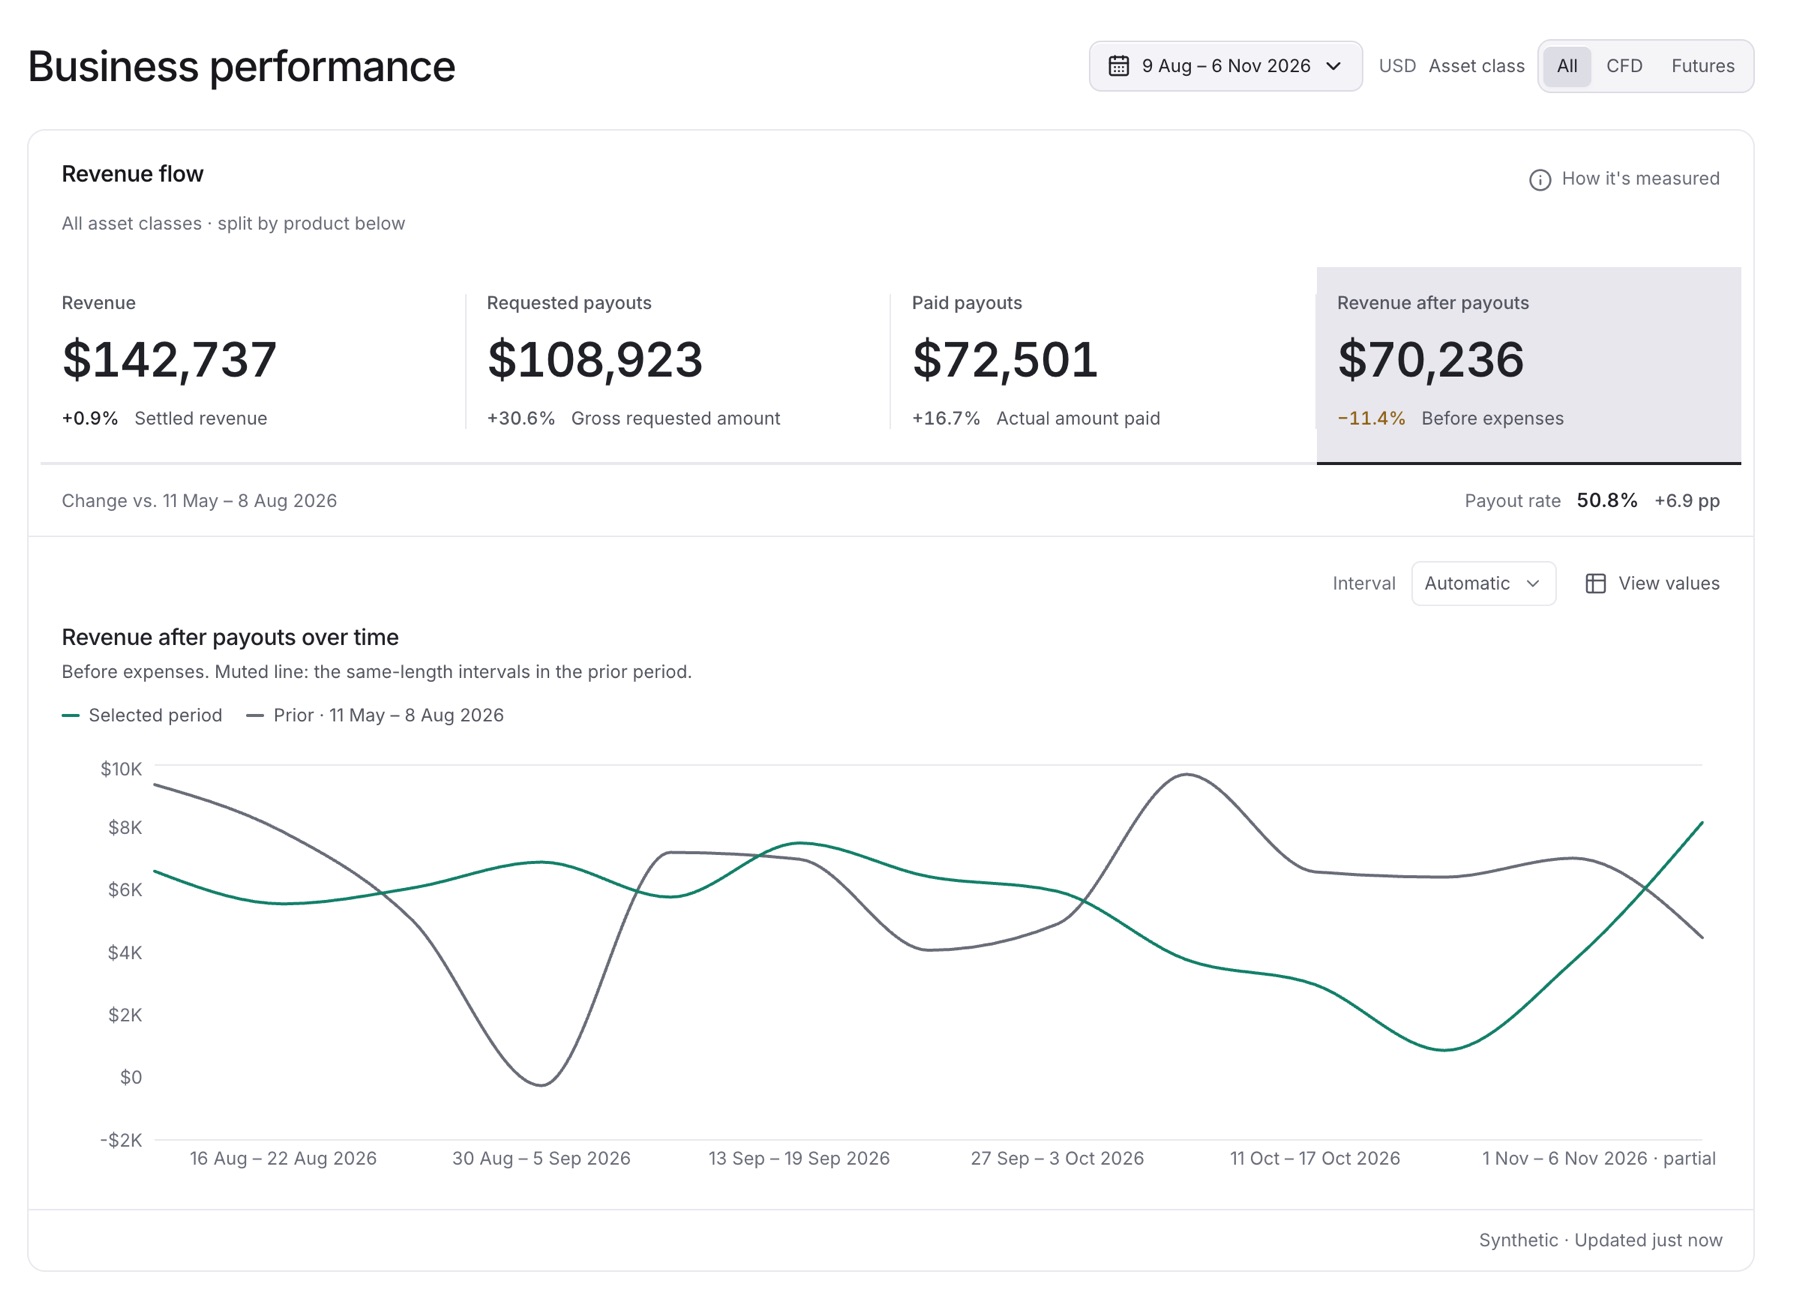
Result: The measures and the chart show your period. The muted line in the chart is the same-length prior period.
Tip: If the chart shows No history, the firm's recorded history does not cover the whole period. Choose a shorter period.
Tip: Revenue after payouts is before expenses. It is not net profit.