
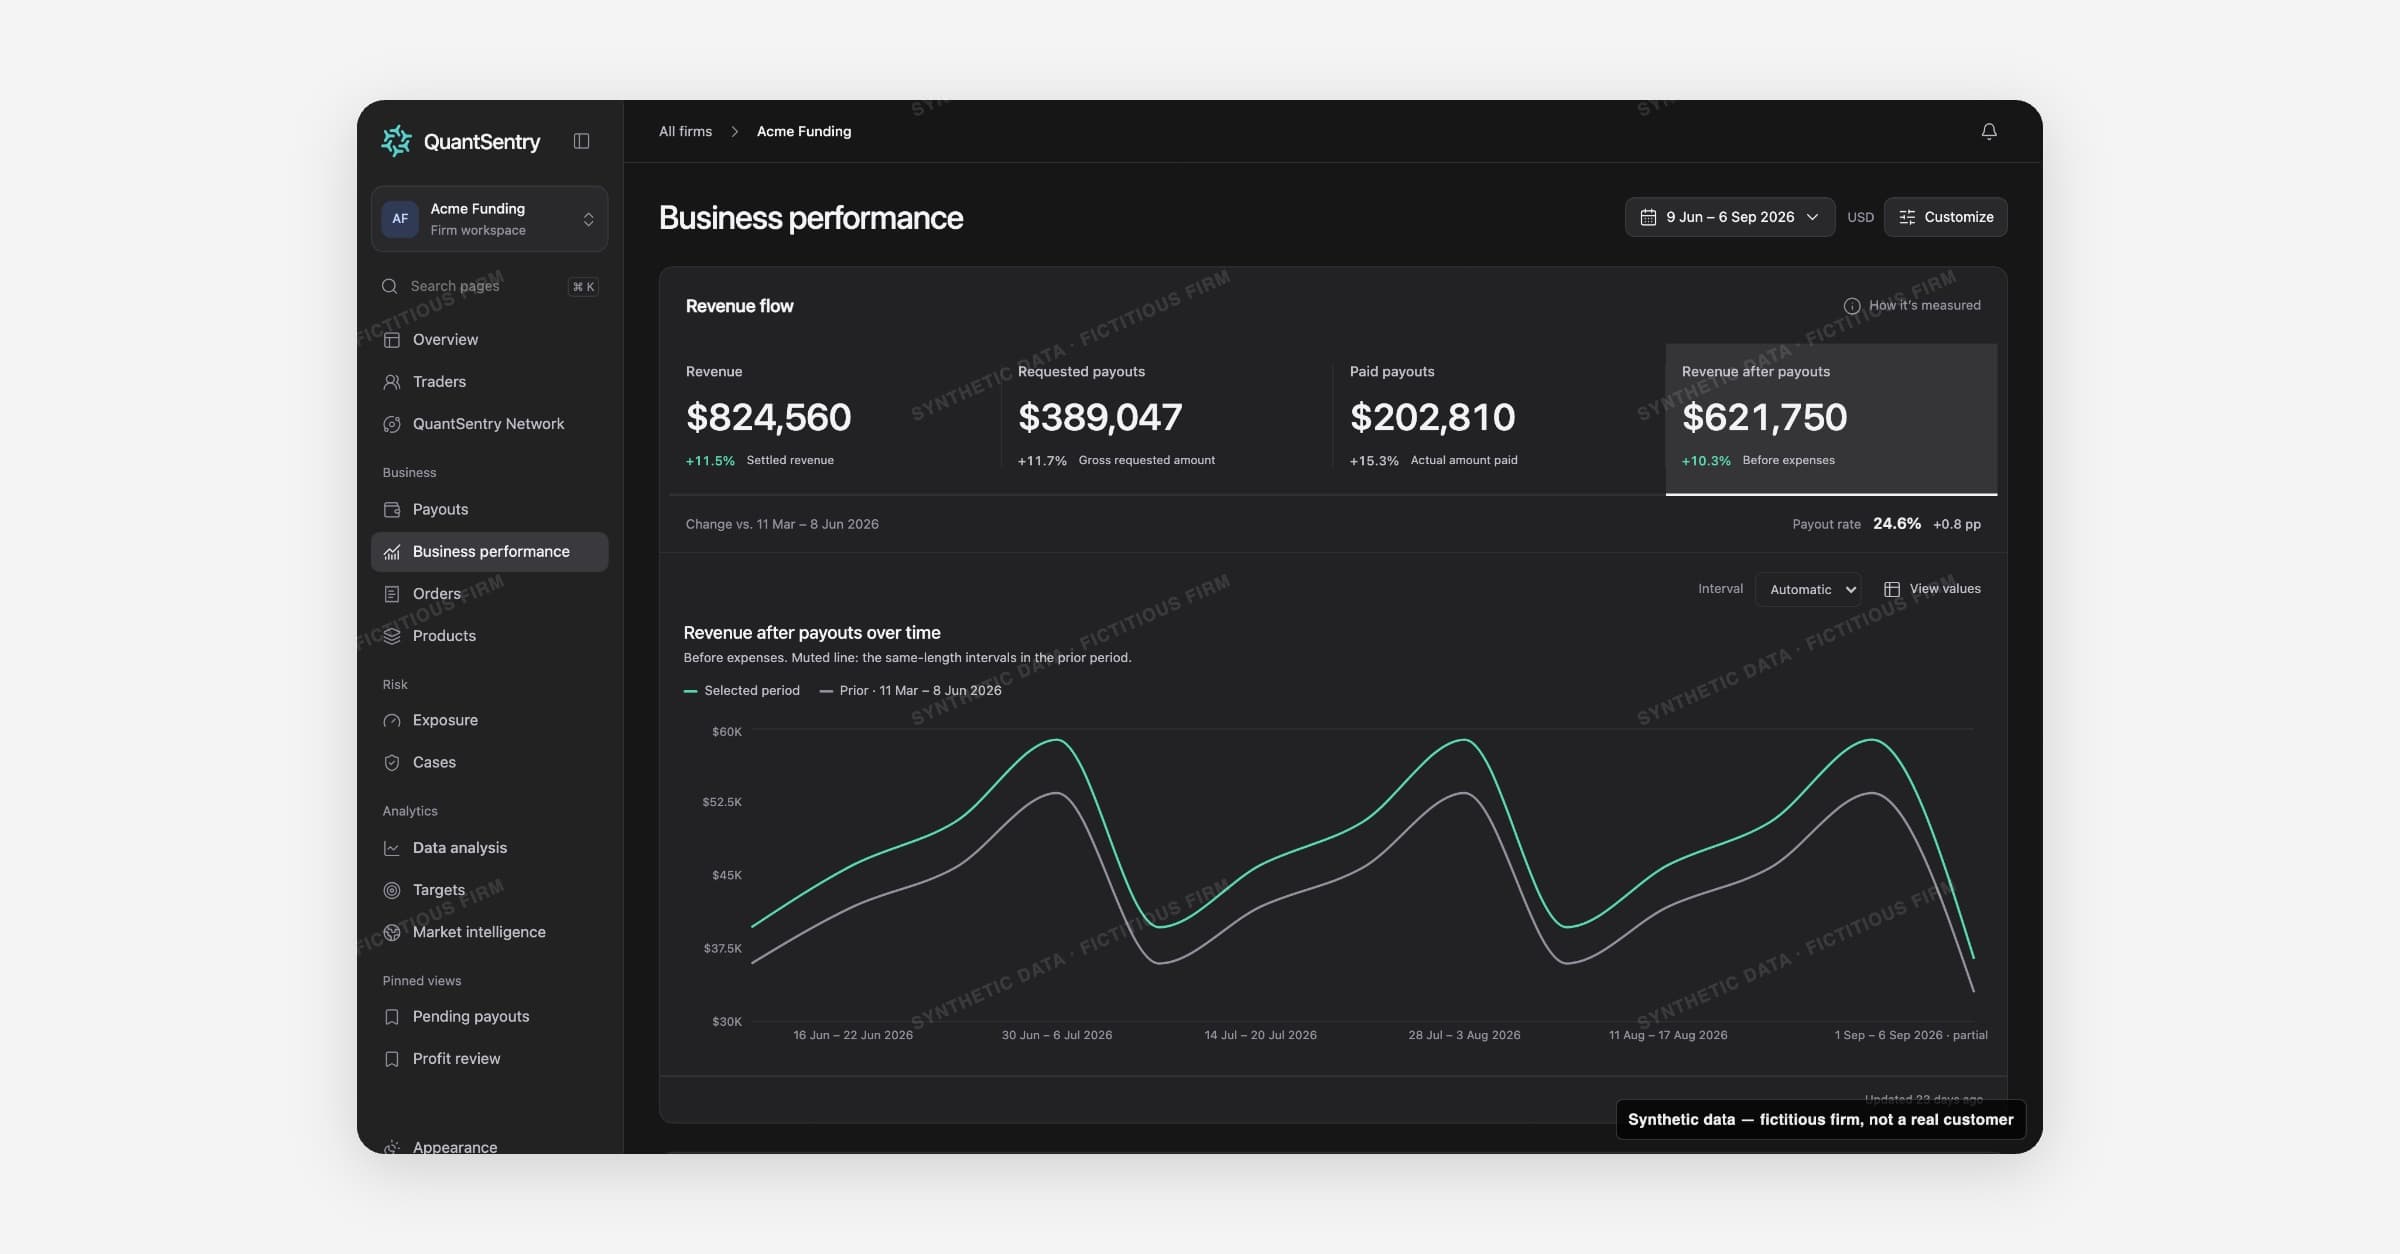
Data Analysis charts how any measure your firm publishes changes over time. Open it from Data Analysis in the ANALYTICS section of the sidebar.
On this page
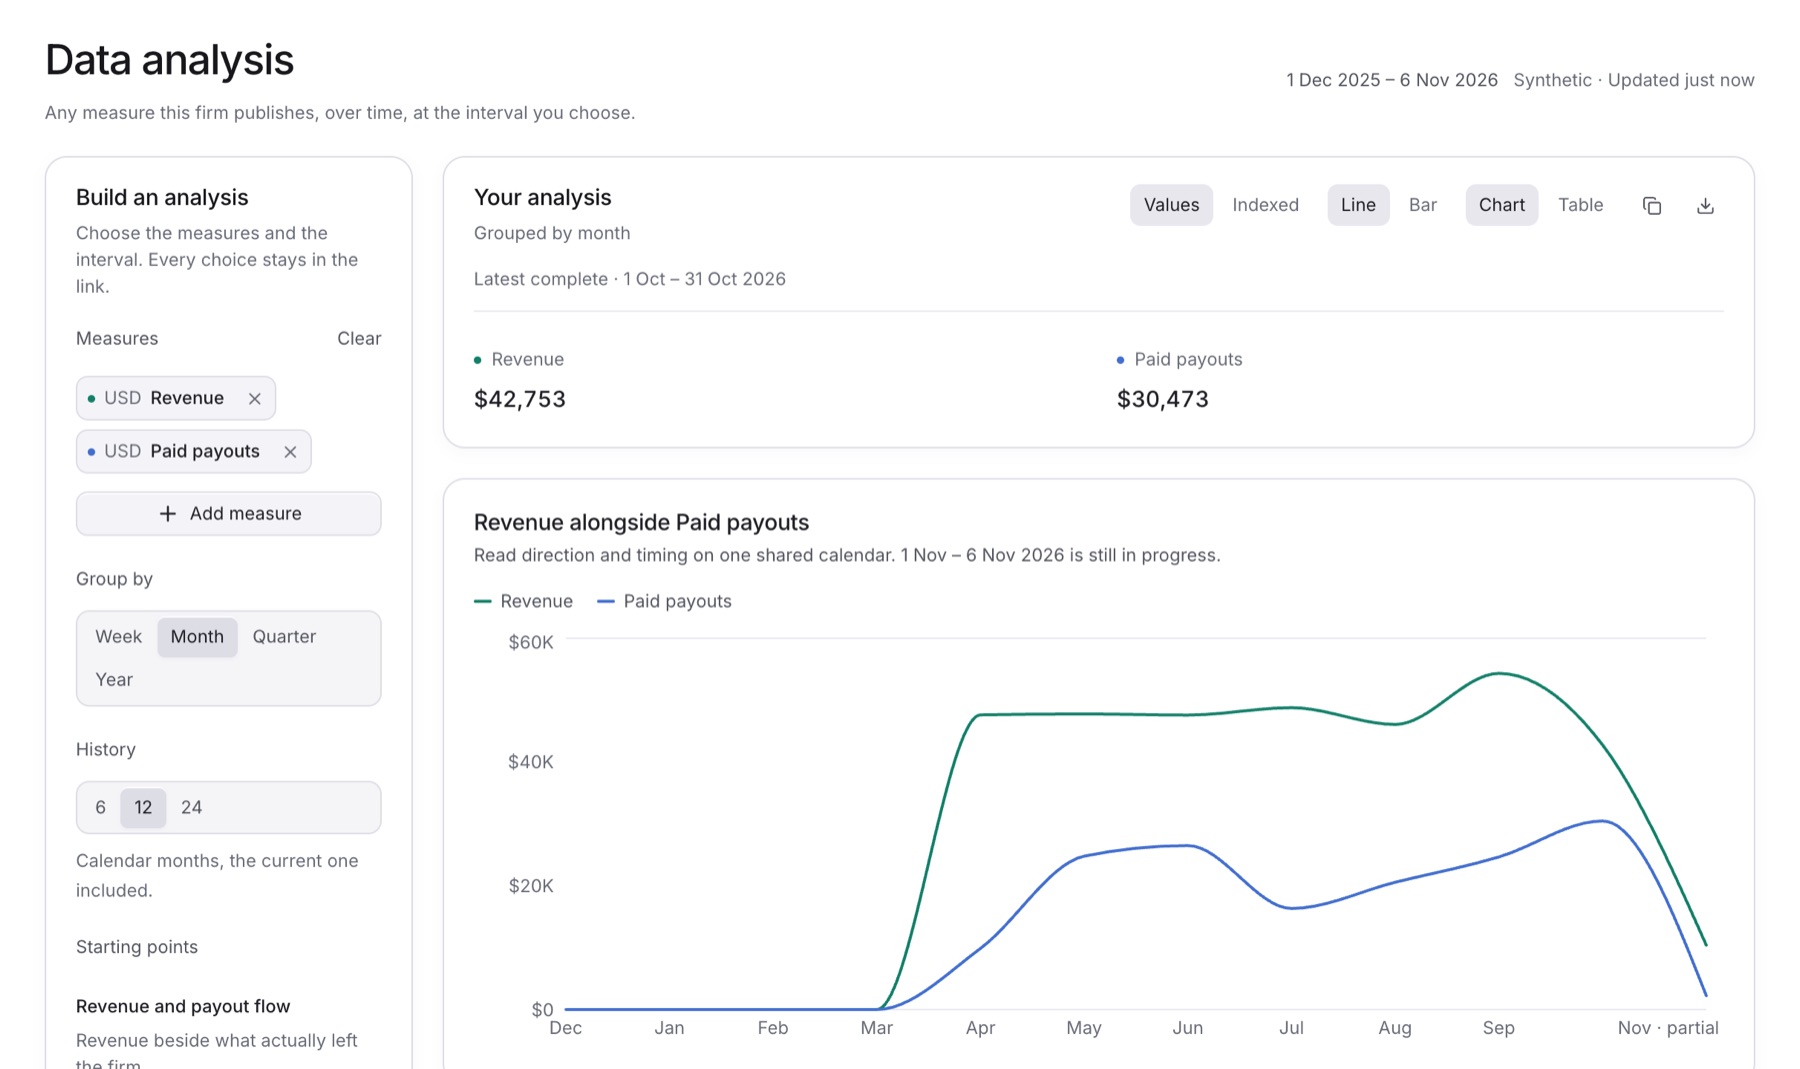
Build an analysis: choose Measures, Group by, History and Starting points.
Your analysis: the latest complete interval, a copy-link button and a CSV download.
Display controls: Values or Indexed, Line or Bar, Chart or Table (Exact values).
Page head: the date window and data freshness.
The page opens on Revenue, by month, over 12 months.
Key ideas
Measures: any metric in your catalog. Up to 4 are drawn at once.
Group by: Week, Month, Quarter or Year.
History: 6, 12 or 24 intervals. An interval still in progress is marked Partial.
Indexed: rebases each measure to 100 at the first interval. Use it for measures with different units.
Starting points: ready-made pairs, such as Requested and paid. Each shows only when your firm publishes both measures.
There is no save button. Every choice lives in the page link, so copy the link to keep or share an analysis.
Guides
Related
Metrics: defines every measure you can add here.
Connections: supplies the data and the freshness in the page head.
Targets: tracks Revenue, Revenue after payouts and Payout rate against your goals.