
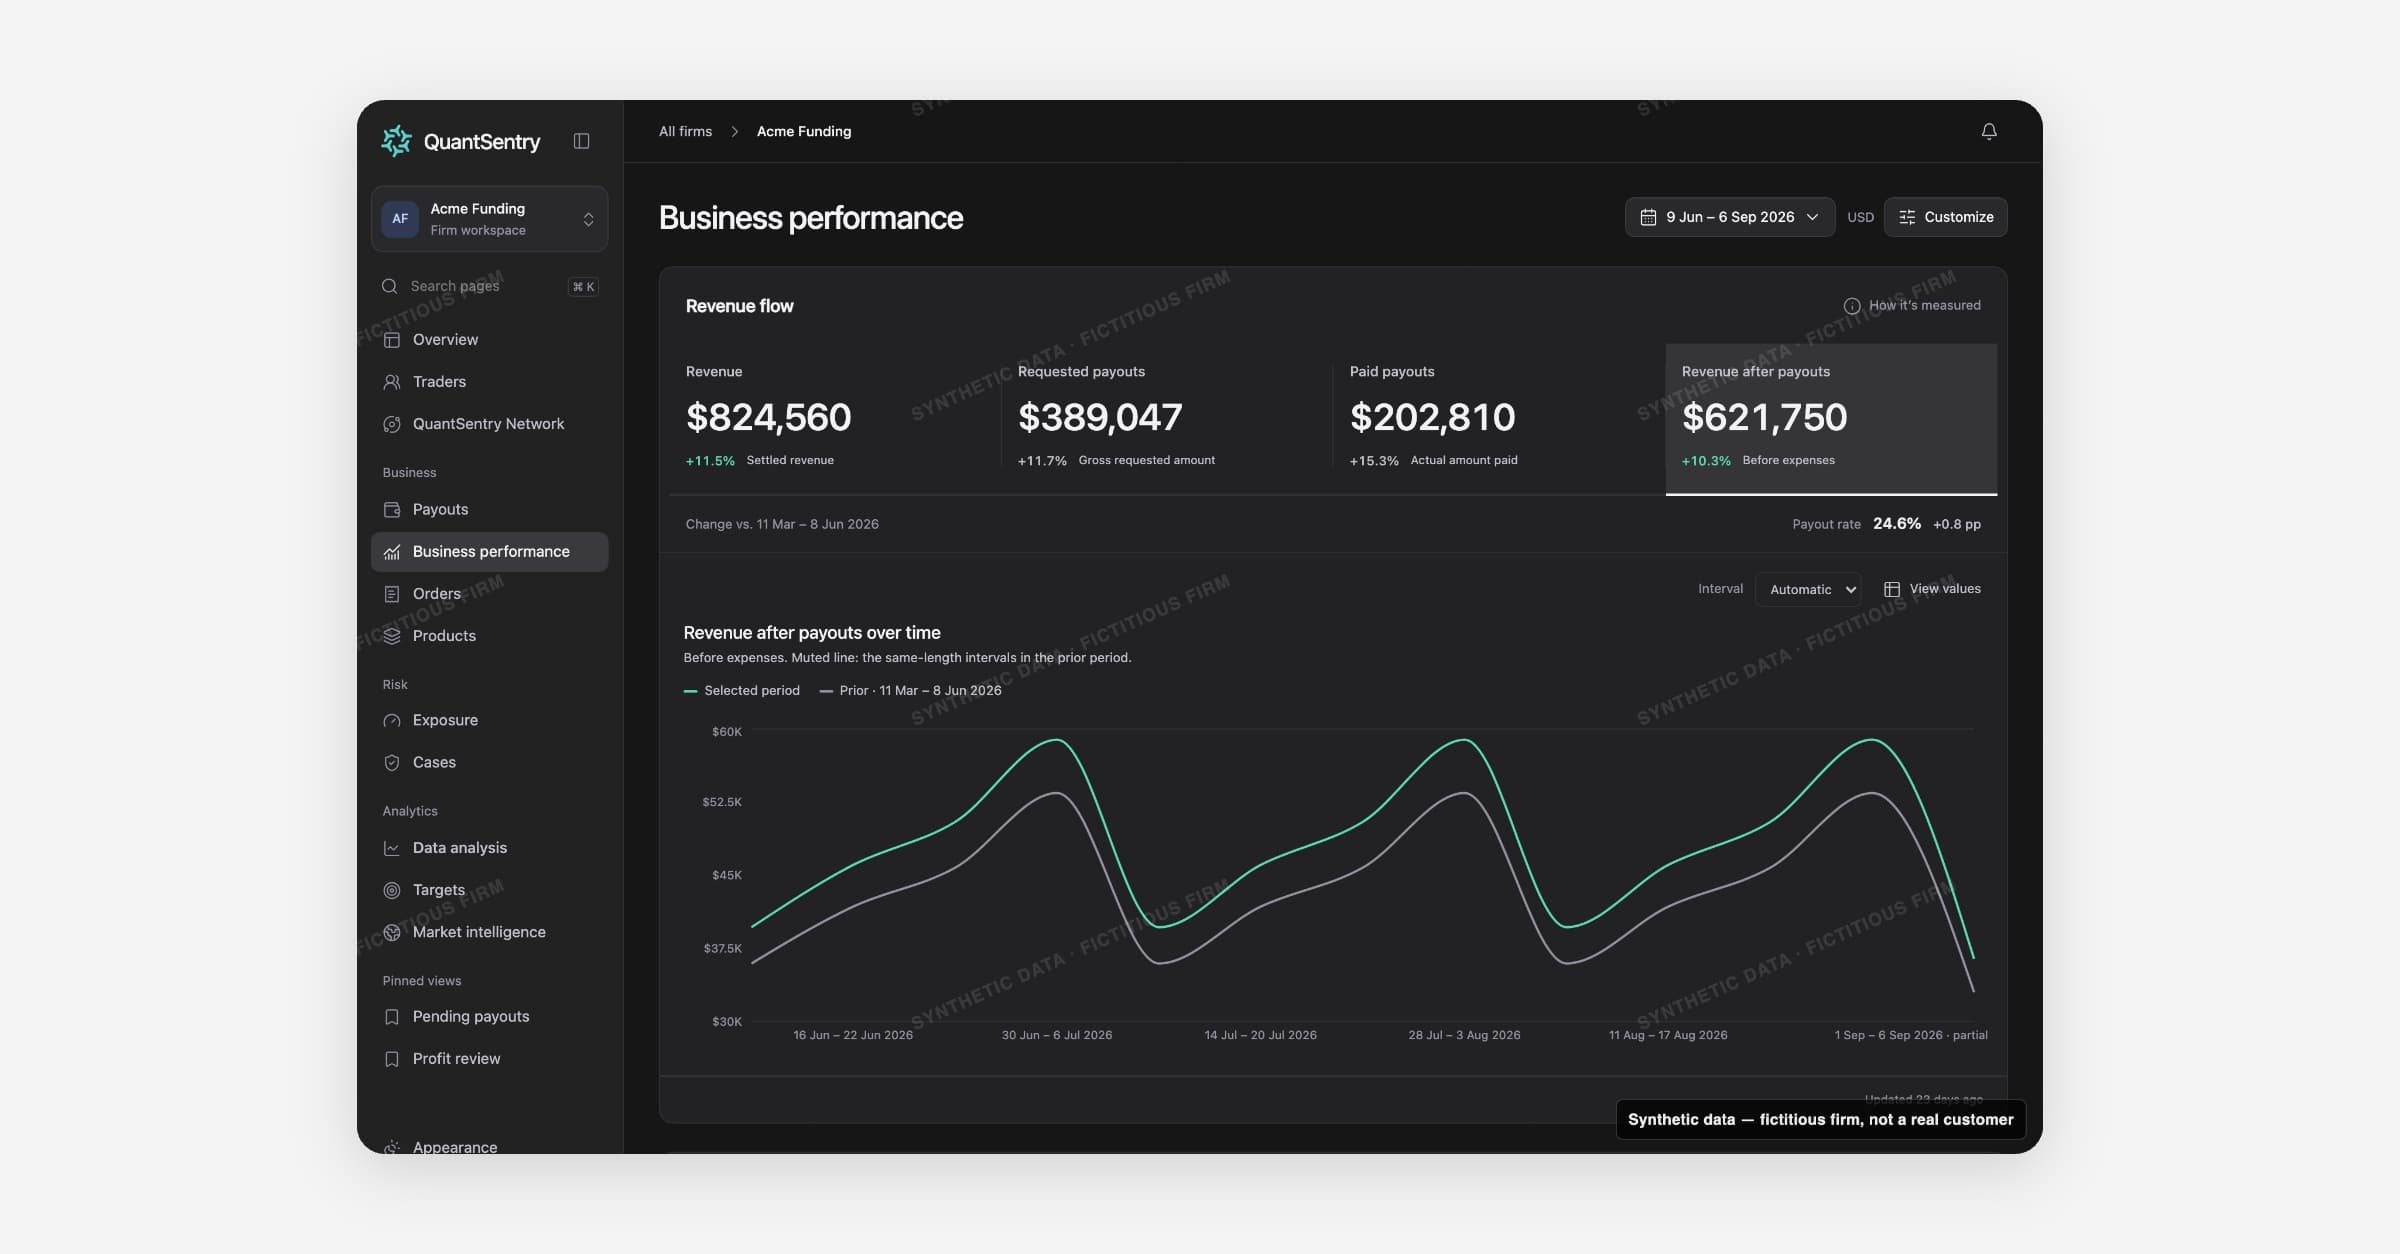
Business Performance shows whether revenue turns into money the firm keeps. It covers the period you choose, compared with the period before it.
Open it with Business Performance in the side menu.
On this page
- Revenue flow: four measures and a trend chart for the period.
- Health Score: a rating of revenue quality and payout balance.
- Product contribution: what each product added in the period.
Revenue flow
Click a measure to show its trend. Revenue after payouts is selected first.
| Measure | Meaning |
|---|---|
| Revenue | Revenue from settled orders |
| Requested payouts | What traders asked for, before the profit split |
| Paid payouts | What the firm paid out |
| Revenue after payouts | Revenue minus paid payouts, before expenses |
- Each measure compares with the prior period, or shows No comparison.
- How it's measured gives the definition.
- Interval switches between Automatic, Weekly and Monthly.
- View values shows the numbers as a table.
Revenue after payouts is not profit. Expenses are not taken off.
Health Score
- The result is At risk, Watch or Healthy.
- Each signal shows its value and the QuantSentry reference.
- The score shows only when asset class is set to All.
Product contribution
- Use Rank by to order the table.
- Click a product to see its orders.
- View all products opens Products.