
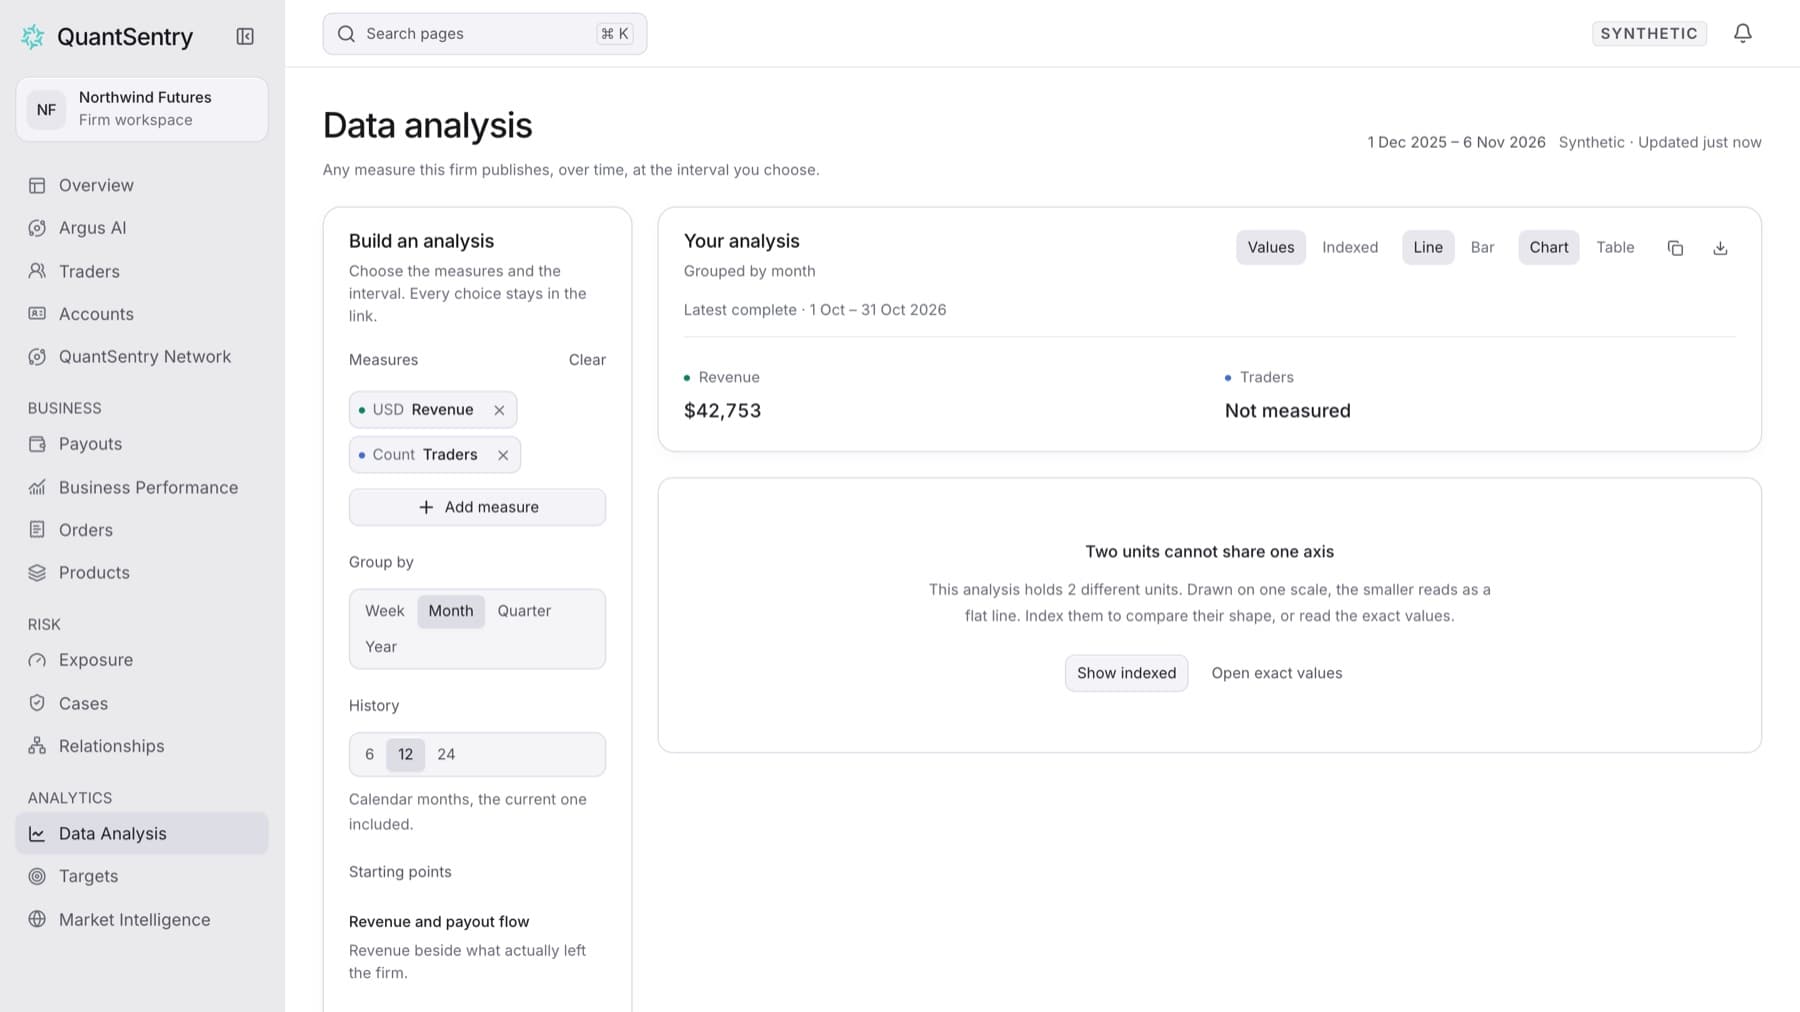
When an analysis holds measures with different units (for example a money amount and a count of traders), Data Analysis cannot draw them on one scale. This guide shows how to compare them. Any workspace member can do this.
- Build an analysis that holds both measures. See Build and share an analysis.
- When the page shows Two units cannot share one axis, select Show indexed.
Tip: You can also select Indexed in the Your analysis panel at any time.
- Read the chart. Every measure starts at 100 at the first interval, so a line at 120 has grown 20% since then.
- To read the real amounts, select Open exact values, or select Table in the Your analysis panel.
- To go back to amounts on the chart, select Values.
Result: The chart shows one line per measure with a reference line labelled Starting point · 100. The legend names each measure.